Voici la question qui me guide dans mes recherches...

L’appât du gain manifesté par les entreprises supranationales et certains groupes oligarchiques, de même que le contrôle des ressources naturelles par ceux-ci, dirigent l’humanité vers un nouvel ordre mondial de type féodal, voir même sa perte. Confronté à cette situation, l’être humain est invité à refuser d’accepter d’emblée une pseudo-vérité véhiculée par des médias peut-être à la solde de ces entreprises et groupes. Au contraire, il est invité à s’engager dans un processus de discernement et conscientisation afin de créer sa propre vérité par la confrontation de sa réalité nécessairement subjective à des données objectives, telles que révélées par la science, par exemple.

The penalty that good men pay for not being interested in politics is to be governed by men worse than themselves. - Plato

mercredi 25 décembre 2013

Are Wildfires in the USA really increasing because of "climate change"

According to the "union of concerned scientist" who sees dire scenarios everywhere... YES.  but it all depends on how you interpret the data.

Here' what they publish that the public accept without questions.


Look at the details of this nice graph.
  1. They used "Science connections"
    1. This look very serious, based on science...right!
  2. They made sure to add CLIMATE CHANGE
    1. How is this working exactly... not clear here, but the general public will think automatically that the more "human CO2" we put in the atmosphere, the more wild fire there is... the graph show it clearly! Right?
  3. They then state "Western US".
    1. This is the first cherry picking of the data
    2. What about the whole US
  4. Then they say: Average number of LARGE wildfires per year
    1. This is the second cherry picking of the data... LARGE overt 1000 acres.
    2. What about all wildfires
    3. What about the numbers of firefighters, the money they have to work or any other reasons.
  5. Then you compare 3 time periods. First and second is 9 years, third is 2 years... This is statically false, you cannot do that.  In high school, you would fail an exam for doing this. This is the UNION of SCIENTIST doing this, nice job!
    1.  They should have split the data set in 3 equal part, from 1989 to 2012 or 3 equal parts of 7.7 years or so.  At least go by months.
  6. Then they talk about average length of season starting in 1970!
    1. Why in the 1970 when the other data starts in 1980 and up?  Cherry picking again?

As you see, you need a lot of cherry picking and data manipulation to draw a conclusion and even there, what are you saying?  Increase Human CO2 causes more fires?  We need to cut our consumptions of fossil fuels to cut CO2?   All this is not said on the published graphs, but its CLEARLY the message that is pushed forward here.

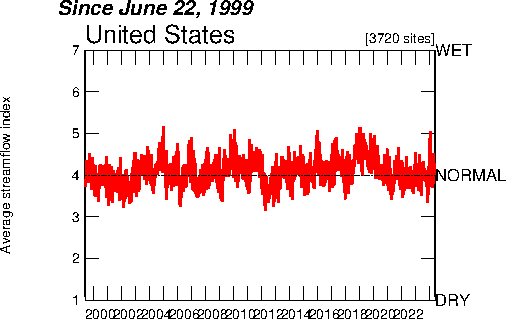
So how much more warm is the US since 1980? The closest I can find related to this "study" is the RSS TLT for continental US.  This shows a temperature change of 0.175K/10 years or around 0.5 K for the 32 years covered.   But when look closely at the average monthly temperature, we have today around the same "swing" of high and low as in 1980.  So for temperature, not much change that would explain this.


What about More WET or DRY... again, not much change here on data available

 Ok what about DROUGHT? From available data... not much correlation.

Now, what if we check the data source and plot all fires size and number of acres burned.  I had to extract the data from here and plot it myself, since it was not available.  The other thing is, that data starts in 2004 up to today.  So from this, you can see that there's a down trend on both Acres burned and number of fires.


From the NIFC, we can find the same data used by the union of concerned scientist on large fires but only from 1997.  Sorting through this and calculating trend, you can see this the following. So yes there seems to be a upper trend of total Acres Burned, but only on large fires and over that time frame, from 1997 to 2012.  When you look closely, you see that the 2012 bar is around the same as 2004, 2006, 2007and the 2011 bar is lower that 2002.  Not sure we can come to any clear conclusion based on this data and even less certain that we can link human CO2 to more forest fires.


Conclusion:

Always be very skeptical when you see "organization" jump to conclusions. Check the data, ask yourself lots of questions.  And above all, always remember that correlation does not mean causation.

For sure, forest fires are bad, people lose their properties, people are killed.  Many have their lives changed forever.  We definitely need more resources to this issue but jumping to conclusions that climate change is responsible for this and that we only need to cut fossil consumption and everything will be all nice and good, is not only misleading but irresponsible and only serves some agenda.

Remember this related to human CO2 (from my twitter feed)

samedi 28 septembre 2013

New IPCC report the other side of the story

We are now bombarded with one liner reports from the mass media like this one. Seems everybody is repeating the same mantra with almost no analysis whatsoever.

Climate scientists are 95% confident that humans are responsible for at least "half of the observed increase in global average surface temperatures since the 1950s." source

There's some much to be said about this report, but let me start by a couple of graphs.

First this one:
The IPCC graph shows that climate models predicted temperatures should have responded by rising somewhere between about 0.2 and 0.9 degrees C over the same period. But the actual temperature change was only about 0.1 degrees, and was within the margin of error around zero. source
You see from this how "mushy" the models are and how they do not track the real observed temperature of the planet.  In reality, the observed temperature change is not a big issue, but what the models show are.  But if we cannot rely on models, why are we believing in them so blindly?  In the words of Ross McKitrick here:
The IPCC must take everybody for fools
Here's some other graphs and sources on how the models are way off from reality.

source


 The above show how the models are running too hot.
source
The above is how 75 models compared with real observed temperature.

So who is the IPCC anyway?  The best video I have seen on this subject is embedded below (source)


What are the real life observations are showing?  You can play with the numbers yourself by clicking here. This graph shows the whole of the HADCRUT 3 unadjusted global mean temperature data set.  We can see that for the past 15 years 1998-2013 we have seen no increase in global temperature while the CO2 (blue line) kept increasing in a linear fashion. So if CO2 is driving the temperature rise, why have we seen a ZERO increase for 15 years?
When you look at this, always remind yourself that this is temperature anomalies.  To better understand what this is, please read this article.


It's interesting to see the real temperature swing.  Here's an example from Quebec City from 1978.  Can you see a temperature trend?  Compared this monthly average of around -15c to +15c or 30 degrees C with the above graph range of -0.2c to 0.6c or 0.8c (anomalies) for the same period.

You also have to note that this station is near a big city that probably saw the "heat island effect"

Another thing you have to consider, is the question of how much human made CO2 is in the atmosphere.  here's a quick video on that subject.


So has you see from the tip of the iceberg view on the climate debate... it's not that clear cut.


More sources of information

samedi 30 mars 2013

Good news for 2013 and the future of humanity.

There's a lot of good news for 2013... First, we did not see the end of the world in 2012 ;-) but there are lots of new scenarios for end of the world 20xx! We like so much to be scared, that's part of human nature I guess.

Then we just saw the world stopped warming for the past decade or more (around 16 years). This is quite easy to view for yourself... just use this web site and play around with the data sets.  Here's one example. You can click on the image below and start from there.


This means my daughter of 17, lived in a world that saw statistically no warming.  This is in sharp contrast with all the gloom and doom scenarios that we hear on the news and papers almost everyday.  You see in blue above that the CO2 is still going up, while for the past 16 we see flat trend on global temperature.

You have to remember the theory of climate change... Here's a quick reminder from wikipedia:
Of most concern in these anthropogenic factors is the increase in CO2 levels due to emissions from fossil fuel combustion
So we hear daily from different groups and media that we need to cut CO2, make sacrifice etc... But, what's happening with the temperature at a standstill while we put more and more dangerous level of CO2 in the atmosphere?  I thought the science was settled? Maybe not. But if this topic interest you, here's a start.

On the more urgent problem side than this is:
  • Poverty and starvation
  • The fact that around 1.3 billions people does not have electricity
  • Desertification
  • Problems related with fossil fuels, aside from CO2
    • Real pollution
    • Resources wars
To resolve those issues I want to propose some more good news.

On the Climate change and desertification side:

Allan Savory: How to green the desert and reverse climate change


Matt Ridley on How Fossil Fuels are Greening the Planet


On the energy side of things... We need to stop burning fossil fuels; Oil, Coal and Gas to produce electricity. This can be done more efficiently with the new Gen 3+ nuclear power stations that we are starting to see installed all over the world and way more safe that we have seen in the first generations of power plants.

There's a lot of new development on the nuclear side of the energy production, here some example.

Thorium Energy
Intro...

Detailed presentation...


You also have promises like the following, that if come true, would remove the needs of all power generation we now use, including fission of Uranium or Thorium.

Lockheed's Skunk Works promises fusion power in four years


So you can see that the future is bright... we now only need bright decision makers to make a difference.

We definitely need to stop investing in low density and unreliable source of power that in the end, only result in more Coal and Gas... here a good talk on this:

Germany Pays Billions to Delay Global Warming for 37 Hours

Link to video

Comments?

mardi 29 janvier 2013

Gentilly 2, exploitable pendant 5 ans?

Selon cet article, Gentilly 2 serait exploitable pendant 5 ans, sans réfection.  Donc un petit calcul s'impose!

La centrale peut produite 625MW, disons qu'elle opère à 80% pour les 5 prochaines années.Ceci nous donne... 625,000KW x 0.8 = 500,000KW de puissance!

Soyons généreux avec notre centrale et accordons le même contrat qu'Hydro à donné à Kruger, donc 10,55 cents/KWh.  Ceci nous donne 500,000x10.55cents = 52,750$ par heure d'électricité vendu... on multiplie par 24h et 365j et 5ans  = 2,310,450,000$

Donc on va perdre 2,3 milliard de dollars sur 5 ans?

Hum...

De plus, si on vendait cette électricité aux américains, il n'auraient pas à brulé du gaz de shale pour compenser... Ceci équivaut environ à 2,5 millions de tonnes de CO2 par années!  donc 12,5 millions de tonnes sur 5 ans.  Une auto moyenne émet 11,450 livres de CO2 par années, donc 12.5 millions de tonnes = 25,000,000,000 livres / 11,450 = 2,2 millions de voitures de moins sur la route (équivalence) si on roulait Gentilly 2 sur 5 ans!

Donc le PQ et les écolos, ont manqué le bateau complètement coté économique et écologique.

Évidement mes calculs sont grossier et rapide, mais même en coupant en deux les revenus et autres, c'est un investissement plus intéressant que la fermeture simple et rapide de la centrale.

Oh et une autre raison qu'ils nous disent pour fermer la centrale, les radiations c'est dangereux... Et bien, mes recherche me prouve le contraire... voir mon nouveau blog pour mes découvertes!

Commentaires?


mercredi 9 janvier 2013

Finally, NASA seem to have broken free of the “settled science” that the IPCC imposed.

Here's a comment on this article by Dr Tim Ball, that need to be re-published and saved... Quite important.

Tim Ball says:
Finally, NASA seem to have broken free of the “settled science” that the IPCC imposed. Climate science was effectively frozen for thirty years and NASA are now getting back to where they were in the 1970s. The last valuable contribution they made was Herman and Goldberg’s, “Sun, Weather and Climate”, in 1978.
It was an article about this scientific block by IPCC that triggered the first of my current lawsuits. Here is that article, slightly amended so Anthony and I likely don’t have to worry about another lawsuit.

http://drtimball.com/2011/corruption-of-climate-science-has-created-30-lost-years/
It appears this publication also marks the breaking of the control Hansen had over climate research at NASA. The comments of Hansen’s boss indicate the degree of political power Hansen had as a bureaucrat. What Hansen was doing publicly and politically probably should have been censured, even prosecuted under the Hatch Act.

http://drtimball.com/2012/nasa-scientist-out-of-control/
I understand that upper management were advised by much higher authority not to touch Hansen. When you look at the manipulations used by Senator Wirth for his appearance before Al Gore’s committee it is not surprising.

http://www.pbs.org/wgbh/pages/frontline/hotpolitics/interviews/wirth.html

This article is a small break through scientifically, but its political implications are profound. Put this with the revisions at the UKMO, and it marks an even greater shift. Can the mainstream media be far behind? They will all want to be on the winning side, especially if it affects funding and credibility.

Ironically, some of the scientists will have more trouble adjusting. As Tolstoi reportedly said,
“I know that most men, including those at ease with problems of the greatest complexity, can seldom accept even the simplest and most obvious truth if it be such as would oblige them to admit the falsity of conclusions which they delighted in explaining to colleagues, which they have proudly taught to others, and which they have woven, thread by thread, into the fabric of their lives.”

This will particularly apply to those scientists who also hold the political view of those who hijacked climate science for a political agenda.

I think NASA and others who let themselves be bullied must be held accountable. I remember in Winnipeg three Environment Canada employees telling me after a presentation that they agreed with me but would lose their jobs if they spoke out. I used to have sympathy for this position – not any more. It is precisely this type of coercion that must be countered at all levels. Why is there need for a whistleblower law in a supposedly open and democratic society.

Maybe now the person(s) who leaked the emails from the Climatic Research Unit (CRU) will reveal themselves.

vendredi 4 janvier 2013

Notes on CO2 and sea level

While reading this blog post I came across this interesting comment from someone called " ferd berple"

1. the ice cores show that CO2 lags temperature by about 800 years. This establishes that temperature drives CO2, by a well accepted principle that cold water can hold more CO2 than warm water.
2. if CO2 ALSO drove temperature, then as more CO2 dissolved in the cold ocean during an ice age, and global CO2 levels fell, it would be impossible for the ice age.
3. similarly, if CO2 ALSO drove temperature, then as more CO2 came out of solution as the oceans warmed at the end of an ice age, it would be impossible for there to be a second ice age.
4. since we have been in a pretty regular series of ice ages every 100k years for a couple of million years, this is strong evidence that CO2 cannot be driving temperature. If it did, then we would either be stuck in a low CO2 ice age, or high CO2 warm age. Transition between the two would not be possible given the small irregularity in the earth’s orbit. Yet we see a regular transition in time with a beat frequency of the earth’s orbit.
I think this is quite important and well said